Admin Portal Dashboard
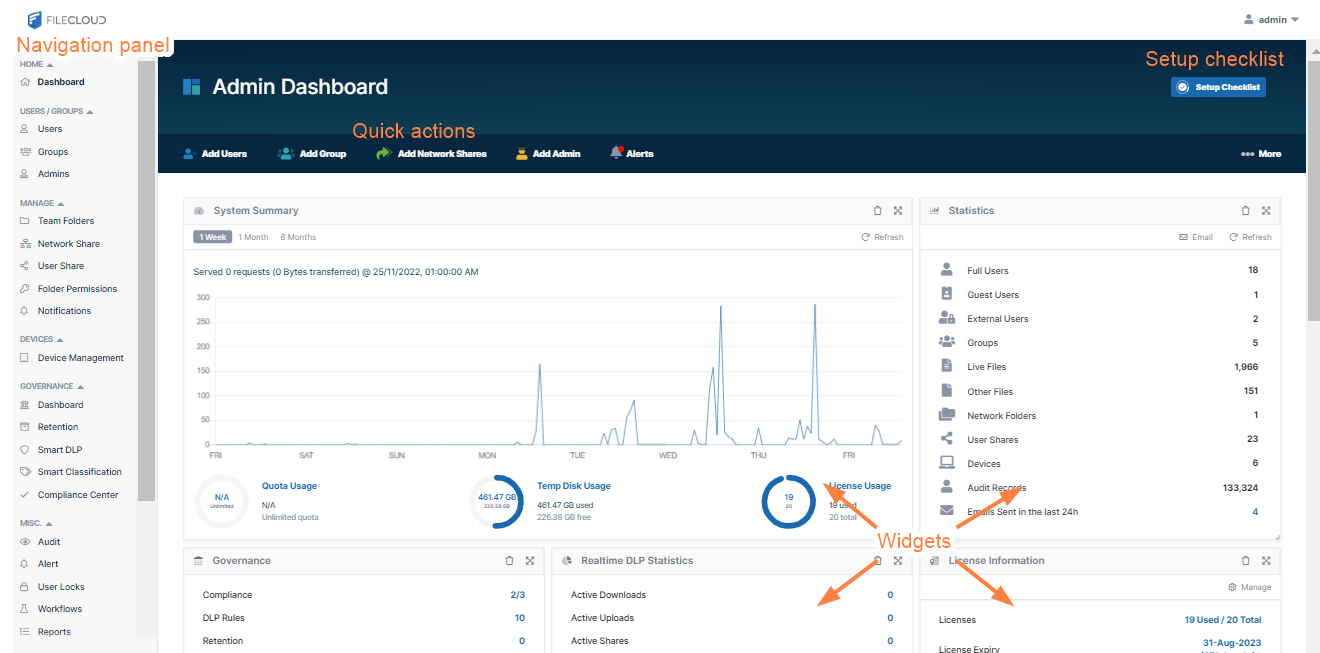
The Admin dashboard, which is the first page you see when you log into FileCloud, is a Web console that provides a monitoring interface for your site.
![]() The Admin dashboard displays several areas to help you manage your site.
The Admin dashboard displays several areas to help you manage your site.
- Navigation pane - The left pane includes a menu that allows you to access other screens where you configure site settings. It appears on all screens in the Admin portal.
- Setup Checklist - This button opens a manually updatable checklist of the tasks generally required for setting up FileCloud.
- Quick actions - The ribbon near the top of the dashboard displays links to common actions such as adding a user and managing alerts.
- Dashboard widgets - The widgets on the dashboard allow you to see at a glance how your site is performing. Note: If you do not have access to a dashboard widget or its contents, it does not appear on your dashboard.
Setup Checklist
The Setup Checklist includes the tasks that are generally required for setting up FileCloud. Click the button in the header of the page to open the checklist.

The Setup Checklist includes various tasks generally necessary for setting up FileCloud, although some tasks may not apply to you.
The tasks Basic Installation Completed and Setup Cron Job are automatically checked/unchecked for you, and you cannot modify them. All of the other tasks are not checked automatically, and you may check them manually to keep track of what you have completed.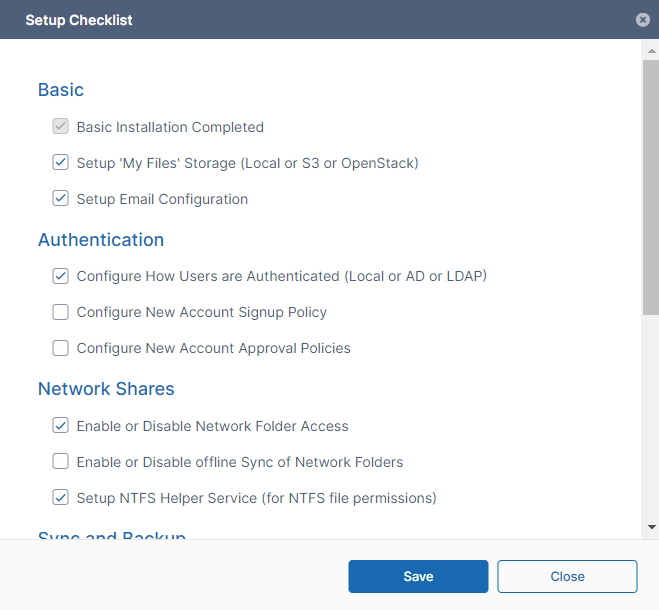
Quick Actions
Links for quick actions are listed in a ribbon near the top of the page. They take you to the screen in the Admin portal for the action, for example, the Add Users link takes you to the Manage Users screen.
The Alerts link takes you to the Manage Alerts screen. It displays a red dot if there are alerts listed on the Manage Alerts screen. You must clear all alerts from this screen to remove the red dot from the Alerts link.
If you are an Admin user, only those quick actions that you have access to are listed.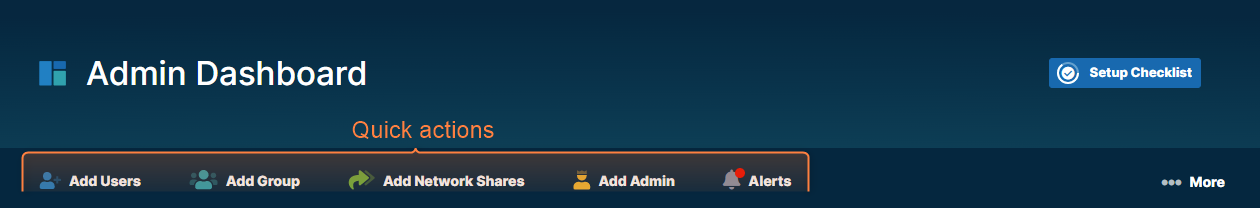
For help performing the quick actions, see:
Add a user
Add a group
Add Network Shares
Add Admin
Alerts
Dashboard Widgets
The FileCloud dashboard has widgets that display real-time information. If you are an Admin user, only those widgets involving actions you have access to are listed.
- Each widget accesses a particular set of data or performs a particular function and presents its information.
- Widgets allow you to visualize operational data with rich visualizations and fast performance.
- Widgets have menus or actions that allow you to access and manage the data quickly.
- Widgets can be rearranged on the screen, as well as removed and restored.
Widget descriptions
This System Summary widget allows you to analyze overall site performance by visualizing relevant data for your site.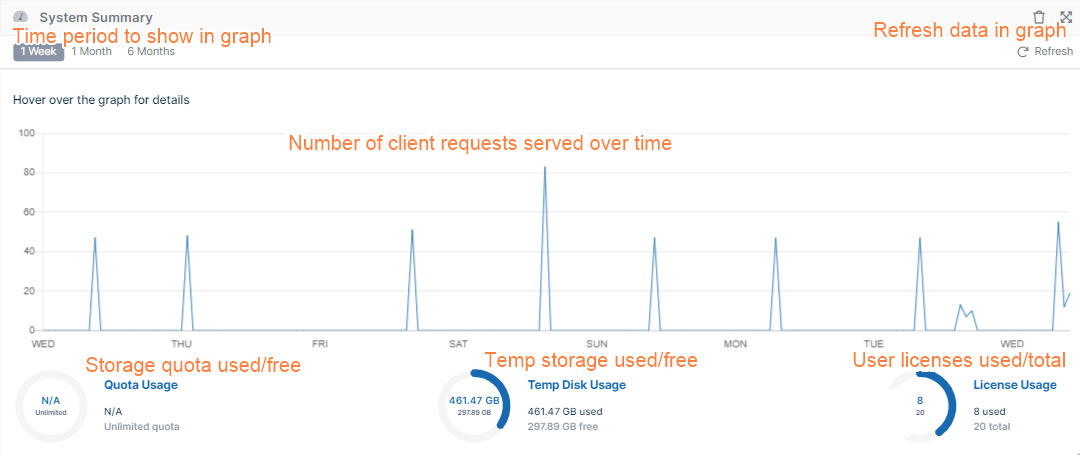
This Statistics widget displays general statistics about your system: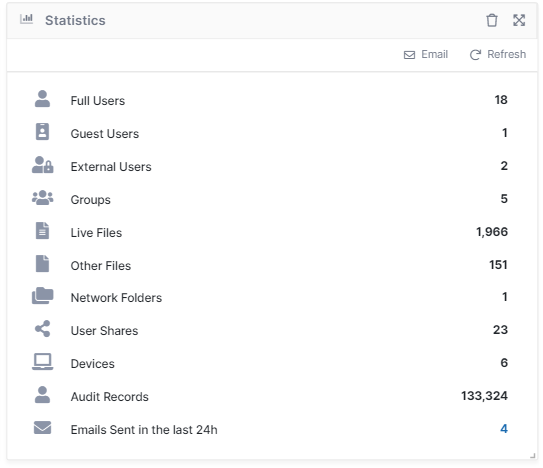
| Icon | Function |
|---|---|
| Sends an Admin Summary email to the admin. By default, an Admin Summary email is sent to the admin every 24 hours. Click number to view report. |
| Refreshes the statistics. |
| Statistic | Description |
|---|---|
| Full / Guest / External Users | Number of full users, guest users, and external users. |
| Groups | Number of groups. |
| Live Files | Number of files stored locally by all users combined that users can access directly from FileCloud folders. |
| Other Files | Other files are additional versions of Live files that users access from the Previous Version option for a file. |
| Network Folders | Number of Network folders. |
| User Shares | Number of shares by each user. A share is counted each time a different user shares it, but only once per time shared, even if it is shared with multiple users. |
| Devices | Number of clients (other than the Web server) that use your system, such as FileCloud Drive, FileCloud Sync, MS Office plugin, MS Outlook plugin, mobile applications, ServerSync, and ServerLink. |
| Audit Records | Number of audit records in the entire system. |
| Emails Sent in the last 24h | Number of emails sent in your system in the last 24 hours. Click the number to view a report. |
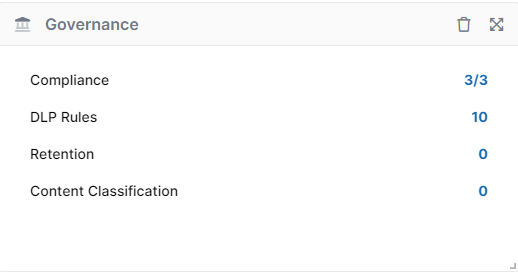
The Governance widget displays counts of your compliance configurations, DLP rules, retention policies and content classification rules. Each count is a link to the screen for configuring the feature.
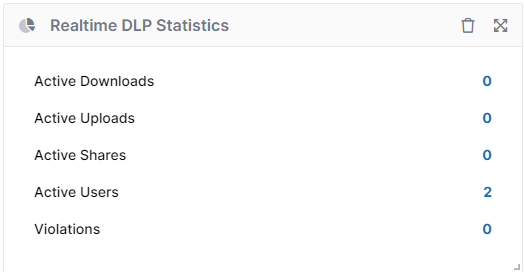
This widget displays DLP statistics in real-time, and displays reports of Active Downloads, Active Uploads, Active Shares, and Active Users when you click the number on the right. When you click the number to the right of Violations, the Manage DLP Rules page opens.
This widget shows you basic information about your license.
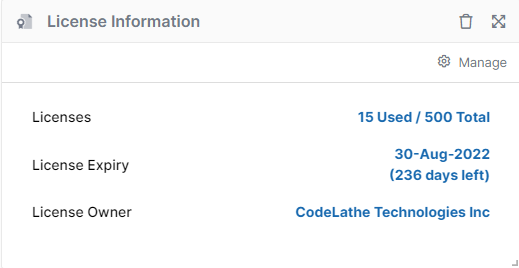
In the upper-right corner of the widget, click Manage to go to the License settings page.
To update your license, see Viewing Your License Details.
The Recent Access Locations report provides the total number of requests received from a geographical location. The countries that had any activities in the last 10 days are shown in blue color. The red points on the map indicate the cities. Moving the mouse over on the cities or countries displays the total number of visits from that particular location in the last 10 days.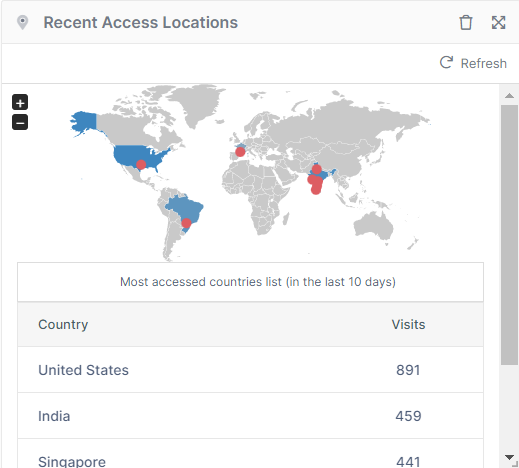
To refresh the report, in the upper-right corner of the Statistics widget, click refresh; then in the upper-right corner of the Recent Access Locations widget, click Refresh.
The Recent Access Locations report is not enabled by default.
To enable the Recent Access Location report:
- In the FileCloud admin portal's left navigation bar, scroll down and click Settings. Then, on the Settings navigation page, click Admin
 .
.
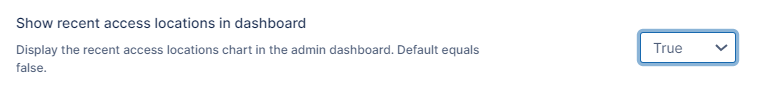
The Admin settings page opens. - Scroll down to Show recent access locations in dashboard, and set it to True.
Settings | Value |
|---|---|
| Show recent access location in dashboard | TRUE - Show the Geo IP Map with data |
| Access locations Server URL | Server URL that converts the IP address to Geo Location Data. To point this URL to a different location contact FileCloud support. |
| Recent access update frequency | The Frequency with which the GeoIP data is retrieved from the server. |
NOTE: The Recent Access Locations map and report displays with proper data only when a Cron job is set up and running and the access IP address recorded in audit is an external IP.
The File type distribution report displays the percentage of files that are stored in the FileCloud by file type extensions such as .PDF, .DOCX etc. Hover your cursor over a section of the chart to view the number of files of that type.

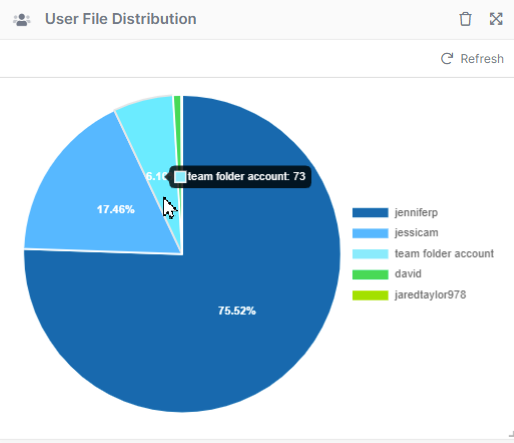
The user file distribution report displays the total number of files that are stored in FileCloud by specific users in percentage. Hover your cursor over a segment of the chart to see the number of files the user is storing.
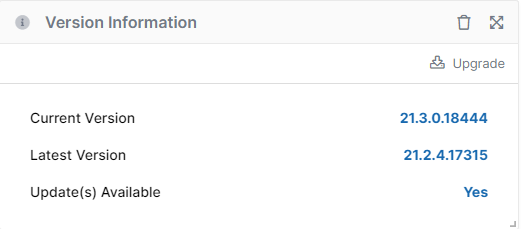
The Version Information widget displays your currently installed version and the latest available version of the system. If there is a new version available, the Update(s) Available button displays Yes.
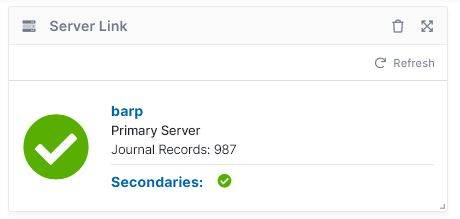
The ServerLink widget is available to customers who have ServerLink running. It gives you a quick view of the status of your ServerLink servers and is similar to the Status tab in the ServerLink settings screen.
ServerLink enables your primary servers and one or more secondary servers that you have in other locations to sync with each other. The widget appears differently depending on whether you are using the primary server or a secondary server.
| User signed into a primary server. |
|
|---|
| This is the way the ServerLink widget appears for a primary server with one secondary server. The check mark with a green background indicates that the server is running. |
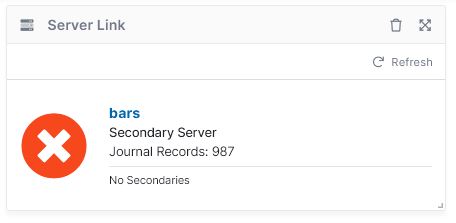
| User signed into a secondary server. |
|
|---|
| This is the way the ServerLink widget appears for a secondary server with an additional secondary server running. The x with a a background indicates that the server is not running. |
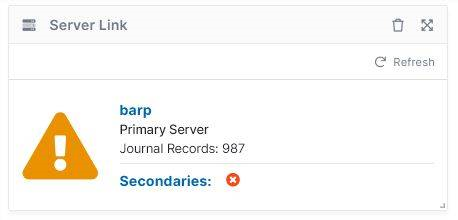
| User signed into a primary server. |
|
|---|
| This is the way the ServerLink widget appears for a primary server when the secondary server is not syncing with it. The primary server displays a exclamation mark with a yellow background. |
Journal Records indicates the number of log entries for ServerLink syncing actions.
For more information, see Viewing ServerLink Information.
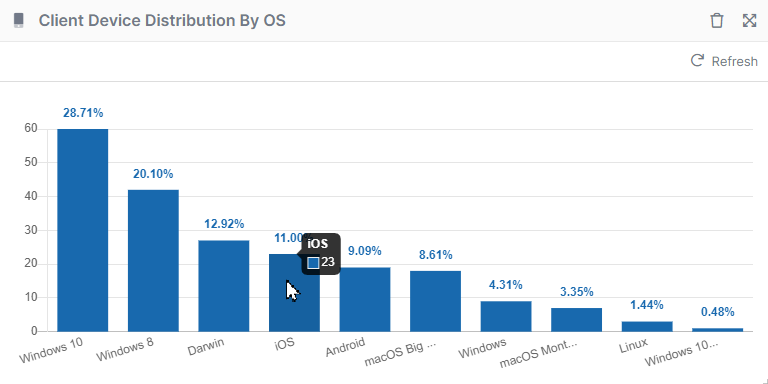
The client device distribution graph displays the total number of devices that are used to connect to FileCloud by OS type such as Windows, iOS, and Android. Hover over a bar to see the number of devices.
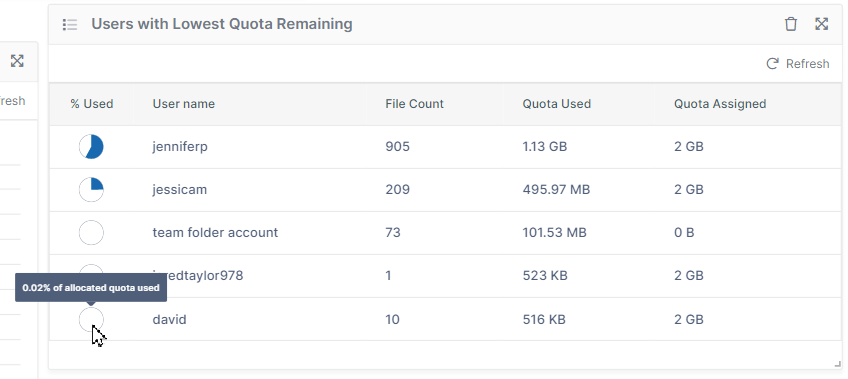
The Users with Lowest Quota Remaining widget displays the 10 users who have used the most disk quota. Hover your cursor over the icon in % Used to see the percent. The widget also gives the total files and the quota assigned for the user.
Rearranging and resetting widgets
To move a widget to a different location on the dashboard, click and hold the cross-arrow icon in the upper-right corner of the widget and drag and drop it to the new location.
To move all widgets back to their original configuration, click More in the header ribbon and choose Reset Widgets.
Removing and Restoring Widgets
To remove a widget from the dashboard, click the delete icon in the upper-right corner of the widget, and then click Remove.
To restore a widget that has been removed, in the upper-left of the screen, click Add New Widget, then click the widget to restore, and click Add. It is added to the bottom of the screen. To move widgets back to their original positions, click More, and choose Reset Widgets (see Rearranging and resetting widgets, above).