Code coverage is an option when you run test methods using Test Explorer. The results table shows the percentage of the code that was run in each assembly, class, and method. In addition, the source editor shows you which code has been tested.
Many tools and techniques for addressing software maintenance problems rely on code coverage information. Often, this coverage information is gathered for a specific version of a software system, and then used to perform analysis on subsequent versions of that system.
Code coverage statistics of one single program run are not very useful. But when we collect and aggregate code coverage statistics of many program runs (with different execution paths), the coverage statistics show us which program parts have not been executed. These parts are either obsolete or should be tested.
What do you need for code coverage?
Step 1:- Installing PHPUnit on Windows
Globally installing the PHAR involves the same procedure as manually installing Composer on Windows:
- Create a directory for PHP binaries; e.g., C:bin
- Append ;C:bin to your PATH environment variable (related help)
- Download here and save the file as C:binphpunit.phar
- Open a command line (e.g., press Windows+R » type cmd » ENTER)
- Create a wrapping batch script (results in C:binphpunit.cmd):
- C:Usersusername> cd C:bin
- C:bin> echo @php "%~dp0phpunit.phar" %* > phpunit.cmd
- C:bin> exit
- C:Usersusername> phpunit --version
- PHPUnit x.y.z by Sebastian Bergmann.
- Open a new command line and confirm that you can execute PHPUnit from any path:
The above installation is for windows for other operating system refer the below link.
Reference: https://phpunit.de/manual/current/en/phpunit-book.html#installation
Step 2:- Installing Xdebug
Follow the instruction given in the link and download the appropriate xdebug for your phpunit
Reference: Xdebug Installation Wizard
- Copy paste the .dll file downloaded from the link into C:xamppphpext
- Configuring php.ini for xdebug support.
- Add the following lines to php.ini file and save the file
zend_extension = C:xamppphpextphp_xdebug-2.2.6-5.5-vc11.dll
xdebug.coverage_enable = on
xdebug.idekey="netbeans-xdebug"
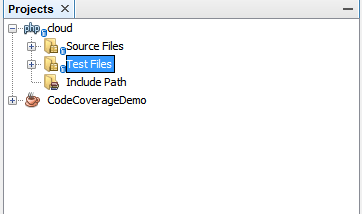
Step 3:- Import your project into the Netbeans IDE
You can have your unit test in separate directory of your project .

Step 4:- Configuring your configuration.xml file
Code coverage reports can be generated in many different formats .Here we have shown how to generate the code coverage report in HTML format.
For other formats of report refer https://phpunit.de/manual/current/en/phpunit-book.html#appendixes.configuration.logging
1. Add a <logging> to pull your report into location of your choice
Sample configuration file:
<?xml version="1.0"?>
<!-- see http://www.phpunit.de/wiki/Documentation -->
<phpunit bootstrap="bootstrap.php"
colors="false"
convertErrorsToExceptions="true"
convertNoticesToExceptions="true"
convertWarningsToExceptions="true"
stopOnFailure="false">
<filter>
<whitelist>
<directory suffix='.class.php'>..xxxframework</directory>
<directory suffix='.class.php'>..xxxxxx</directory>
<directory suffix='.class.php'>..xxxx</directory>
</whitelist>
</filter>
<logging>
<log type="coverage-html" target="C:xampptmpreport" lowUpperBound="35"
highLowerBound="70"/>
</logging>
</phpunit>
Step 5:- Run your test with code coverage
Netbeans IDE with 7.0 or later version supports code coverage.
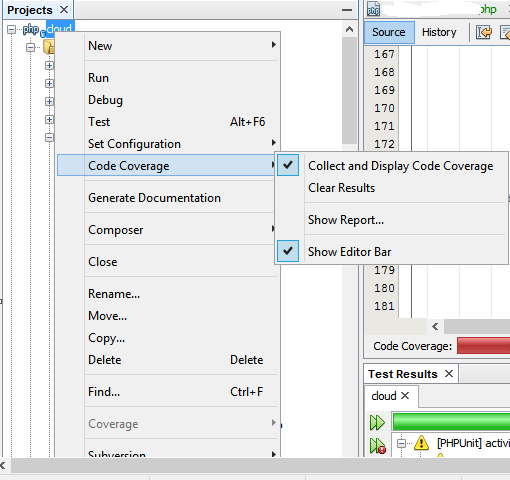
1. Go to your project and choose Code Coverage from the context menu

2. Choose show reports from the CodeCoverage which opens a coverage window. Choose Reports button.

3. Click on Run All Tests ,Once All the test are run the coverage report is available in your path specified in the configuration.xml file.

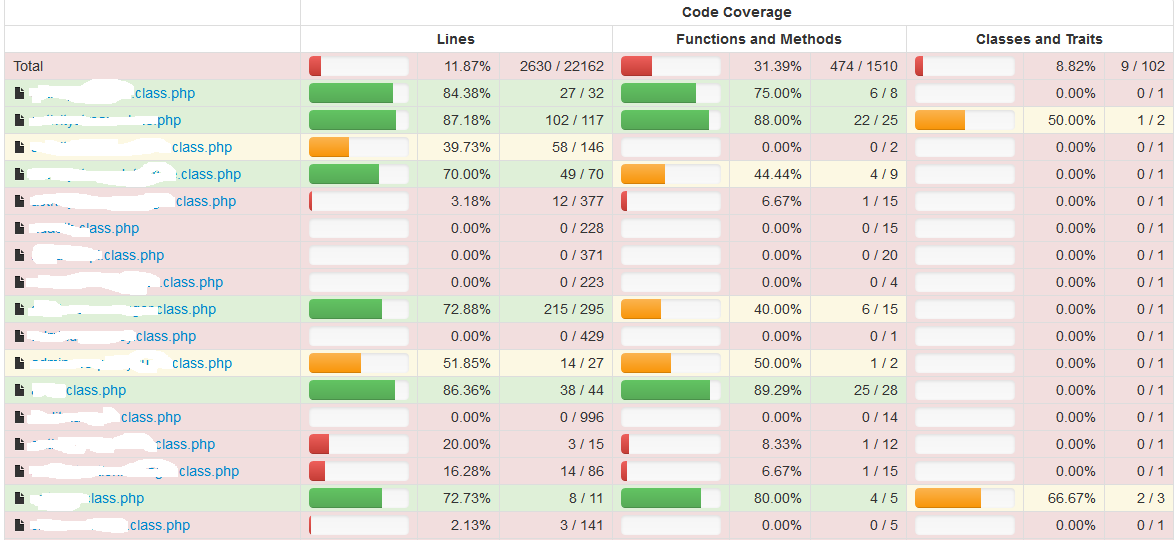
Step 6:- Sample coverage report
Fig : 1

Fig : 2

Step 7:- To Generate report even when some of the test fails .
Make changes to your configuration.xml file to generate full coverage report.
stopOnFailure="false"
Reference: Appendix C. The XML Configuration File
PHPUnit

By Team FileCloud