Note: this blog post is intended for system and IT administrators who manage FileCloud Server environments.
FileCloud Server is a powerful on-prem file sharing and data governance solution for enterprises and institutions around the world. One of FileCloud’s strengths is the ability to integrate with third-party applications to better serve an organization; these include Active Directory and LDAP, Windows file servers, Salesforce, Microsoft and Google productivity apps, even security tools for SAML SSO, antivirus, malware protection, and SIEM.
In this article, we will describe how Zabbix, an open-source software, can be used to monitor a FileCloud Server environment.
What is Zabbix?
Zabbix is an open-source monitoring software tool for diverse IT components, including networks, servers, virtual machines (VMs), and cloud services. Zabbix provides monitoring metrics, such as network utilization, CPU load, and disk space consumption.
The software is capable of monitoring operations across operating systems, including Linux, Hewlett Packard Unix (HP-UX), Mac OS X, and Solaris; however, Windows monitoring is only possible through agents.
Zabbix can be deployed for agent-based and agentless monitoring:
Agent-based Monitoring
Agents are installed on IT components to check performance and collect data. The agent then reports back to a centralized Zabbix management server. That information is included in reports or presented visually in the Zabbix graphical user interface (GUI). If any issues are detected, Zabbix will notify or alert the user.
Agentless Monitoring
Agentless monitoring accomplishes the same type of monitoring by leveraging the existing resources within a system or device to emulate an agent. The Zabbix web-based GUI enables users to view their IT environment via customizable dashboards based on widgets, graphs, network maps, slideshows, and reports
Requirements to Configure FileCloud and Zabbix
In this scenario, FileCloud Server has been installed in three nodes, as per the table below. (Note: MongoDB works in replica sets, and a minimum of 3 nodes are required.)
You can monitor a single node installation using the same steps. The FileCloud Server nodes are following the FileCloud Requirements.
| Server name |
IP |
Server Role |
| FCserver1.localdomain |
192.168.10.241 |
Web, DB |
| FCserver2.localdomain |
192.168.10.242 |
Web, DB |
| FCserver3.localdomain |
192.168.10.243 |
Web, DB |
We also have a Zabbix Appliance which is installed under AlmaLinux 8 (x86_64):
| Server name |
IP |
| appliance |
192.168.10.230 |
Configure FileCloud and Zabbix
- Install FileCloud Server.
- Configure the FileCloud instance.
- Configure FileCloud High-Availability (skip this step if you are using a FileCloud Server single node installation).
- Install Zabbix Appliance (this provides all the required Zabbix components in the fastest deployment. Download the ISO and use it as a source installation image. You can read more detailed installation instructions in the Zabbix documentation.)
The default user/password for Zabbix Appliance and Zabbix Frontend are below:
Zabbix Appliance
root:zabbix
Zabbix Frontend
Admin:zabbix
Specify Static IP Address
The appliance uses DHCP to obtain the IP address by default. Follow the below steps to specify a static IP address:
- Log in as root user.
- Open /etc/sysconfig/network-scripts/ifcfg-eth0 file.
- Replace BOOTPROTO=dhcp with BOOTPROTO=none.
- Add the following lines:
IPADDR=<IP address of the appliance>
PREFIX=<CIDR prefix>
GATEWAY=<gateway IP address>
DNS1=<DNS server IP address>
Example:
[root@appliance network-scripts]# cat ifcfg-eth0
DEVICE="eth0"
BOOTPROTO=none
NM_CONTROLLED="no"
PERSISTENT_DHCLIENT=1
ONBOOT="yes"
TYPE=Ethernet
DEFROUTE=yes
PEERDNS=yes
PEERROUTES=yes
IPV4_FAILURE_FATAL=yes
NAME="eth0"
IPADDR=192.168.10.230
PREFIX=24
GATEWAY=192.168.10.1
DNS1=192.168.10.230
DNS2=192.168.10.230
After making these changes, run the systemctl restart network command to implement the new IP settings.
Set the System Clock
By default, the appliance uses UTC for the system clock. To change the time zone, copy the appropriate file from /usr/share/zoneinfo to /etc/localtime as per the below example:
(here, we are using “Sao Paulo.”)
[root@appliance ~]# cp /usr/share/zoneinfo/America/Sao_Paulo /etc/localtime
cp: overwrite '/etc/localtime'? y
[root@appliance ~]#
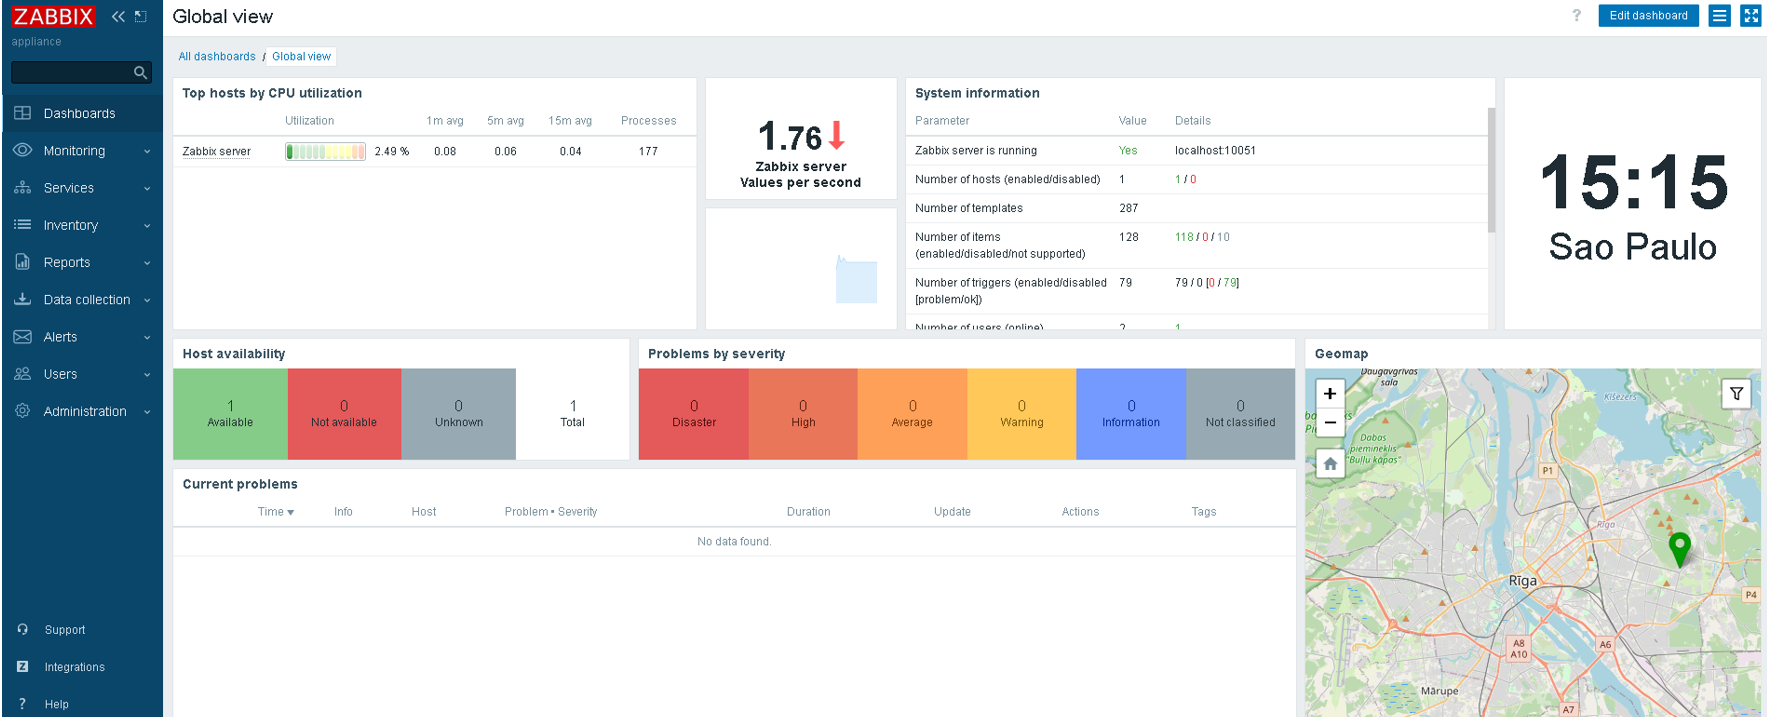
Log in to Zabbix
Log in to the Zabbix Frontend by opening http://host; for our example, we are using http://192.168.10.230:
Install Zabbix on FileCloud Server Node(s)
- Install the Zabbix agent on each FileCloud Server node, as per the below steps:
- Install the Zabbix repository by running the below commands:
rpm -Uvh https://repo.zabbix.com/zabbix/6.4/rhel/9/x86_64/zabbix-release-6.4-1.el9.noarch.rpm
dnf clean all
- Install Zabbix Agent 2 by running the below command:
yum install -y zabbix-agent2.x86_64
- Edit the file /etc/zabbix/zabbix_agent2.conf on each FileCloud Server node and change the following parameters as per the below example:
Server=192.168.10.230
ServerActive=192.168.10.230
HostMetadata=Linux
HostnameItem=system.hostname
(The "HostnameITEM" parameter does not exist in zabbix_agentd.conf -- you need to manually add it)
- Restart the Zabbix Agent on each FileCloud Server node by running the below command:
systemctl restart zabbix-agent2.service
- Enable the Zabbix agent to be started upon boot:
systemctl enable --now zabbix-agent2.service
- Add a firewall rule for Zabbix agent (FileCloud servers) and HTTP/HTTPS protocols:
firewall-cmd --add-service={http,https} –permanent
firewall-cmd --add-port={10051/tcp,10050/tcp} –permanent
firewall-cmd –reload
Create Hosts in Zabbix GUI
Now, let’s create a new host in Zabbix GUI following the below steps:
(These steps will need to be done for each FileCloud Server node.)
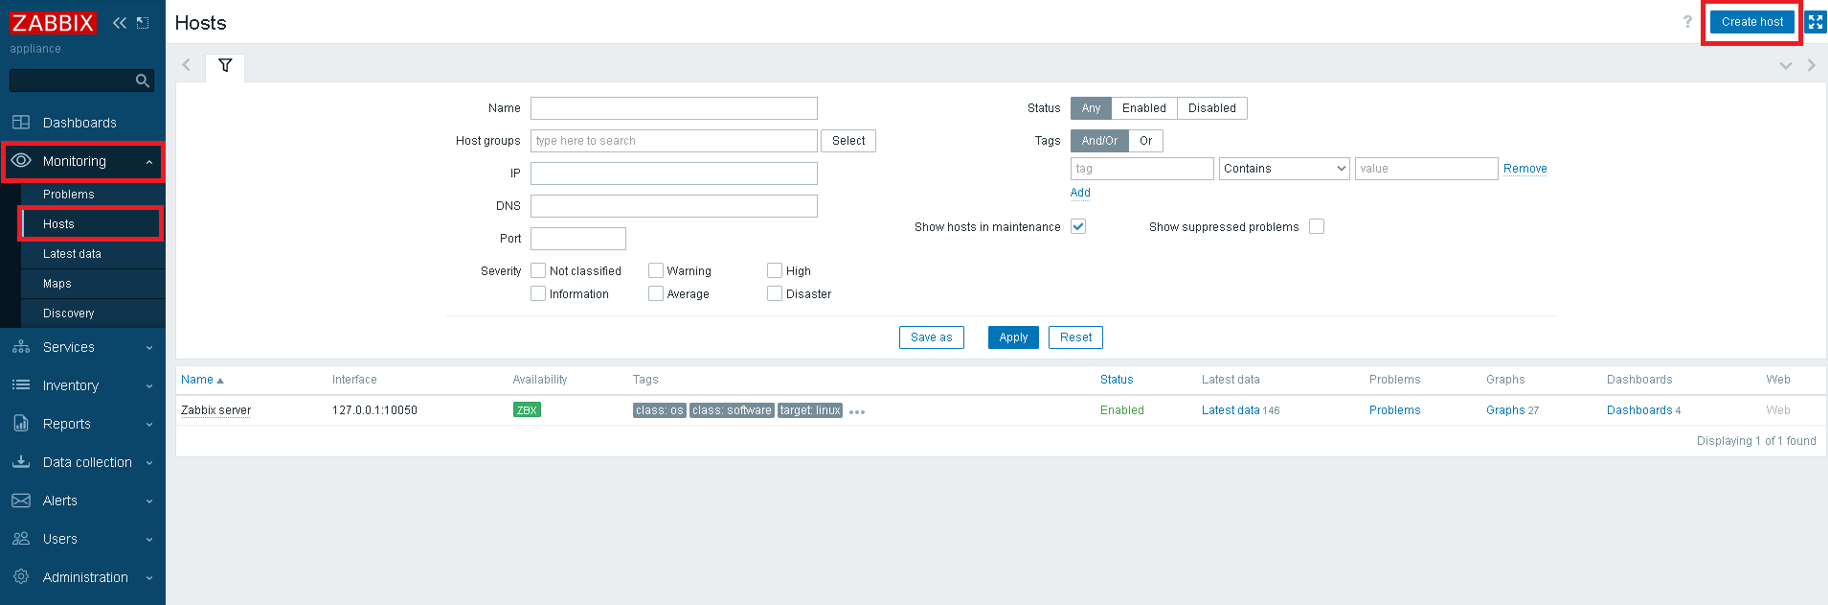
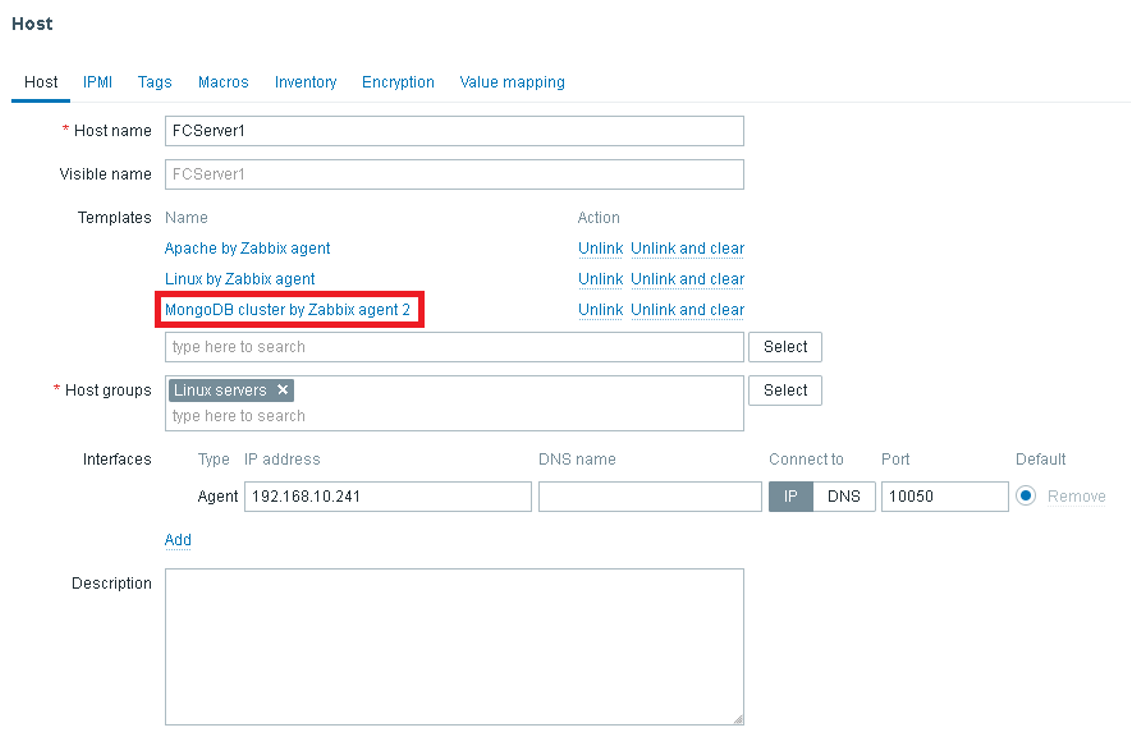
- Click on “Monitoring” > “Hosts” > “Create Host”.
- Add the “Host name” of each FileCloud Server node.
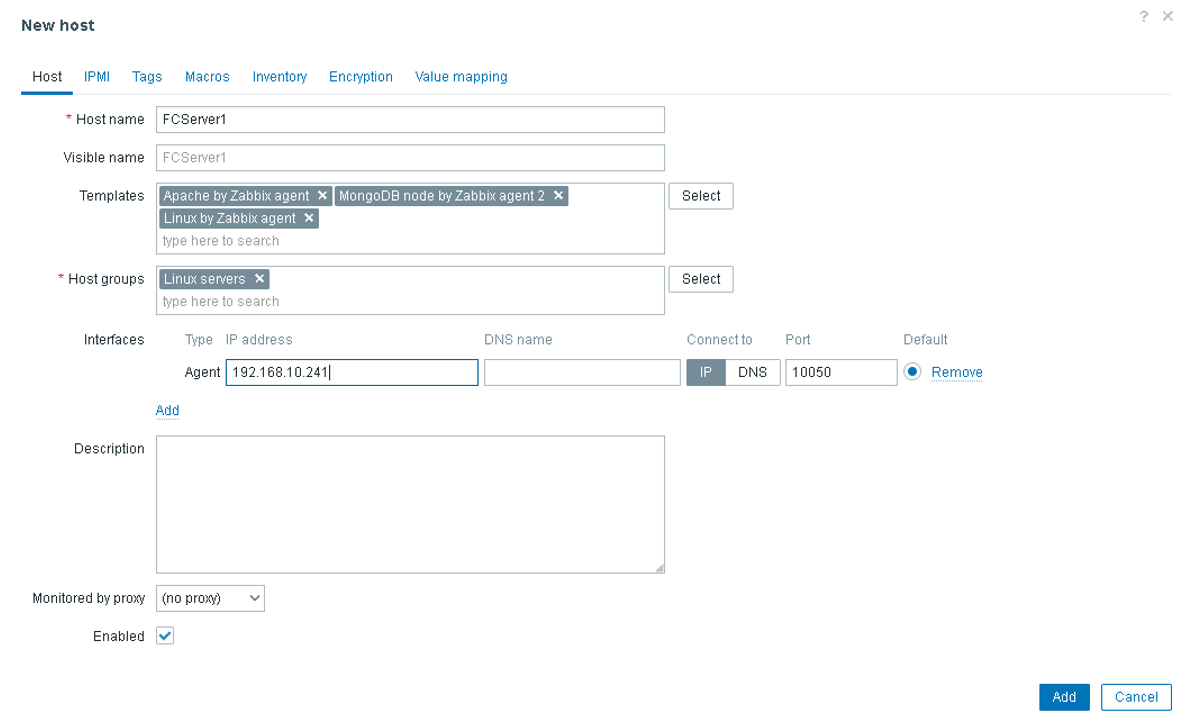
- On “Templates”, find “Apache by Zabbix agent,” “MongoDB node by Zabbix agent2,” and “Linux by Zabbix agent”.
- On “Host groups”, click on “Select” then choose “Linux servers”.
- On “Interfaces,” click on “Add” > “Agent” then replace “127.0.0.1” by each FileCloud Server node’s IP.
- Click on “Add”.
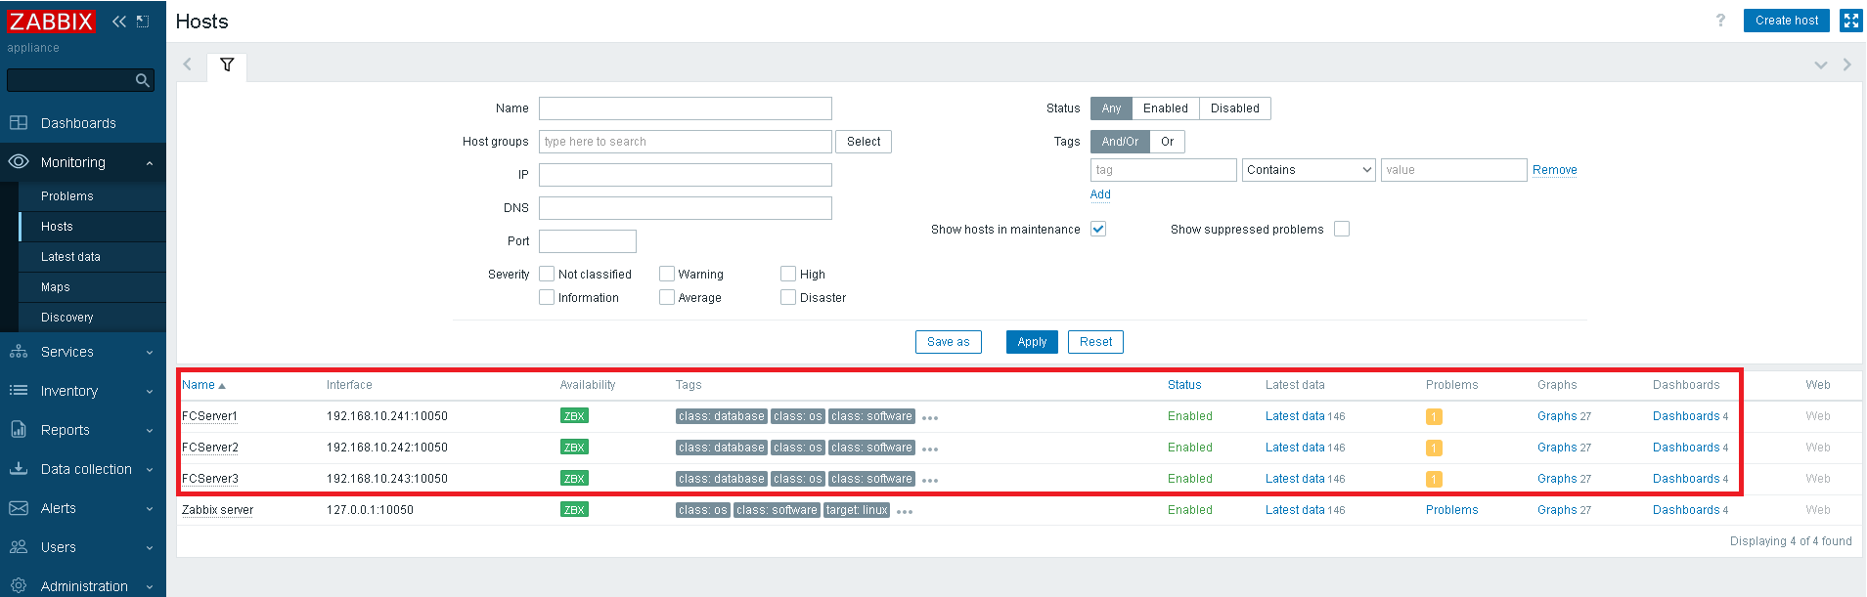
The FileCloud Server nodes were successfully added to Zabbix:
Configure Apache Monitoring on FileCloud
Follow the below steps to have Apache monitoring in place:
(This needs to be executed on each FileCloud Server node.)
- Create the file /etc/httpd/conf.modules.d/status.conf.
- Add the below lines and replace 168.10.230 with your Zabbix Appliance IP:
<Location "/server-status">
SetHandler server-status
Require ip 192.168.10.230
</Location>
- Restart the httpd service using the below command:
systemctl restart httpd
Configure MongoDB Monitoring on FileCloud
Follow the below steps to have MongoDB monitoring in place:
(This needs to be executed on the primary MongoDB node if you are using HA in FileCloud; if not, run this command on the single MongoDB node.)
Here, we are creating the zabbix_mon user with zabbix_mon as the password.
db.createUser(
{
user: "zabbix_mon",
pwd: "zabbix_mon",
roles: [ { role: "userAdminAnyDatabase", db: "admin" } ]
}
)
Install the Zabbix MongoDB plugin running the below command on each FileCloud Server node:
yum install zabbix-agent2-plugin-mongodb -y
Configure the MongoDB Template
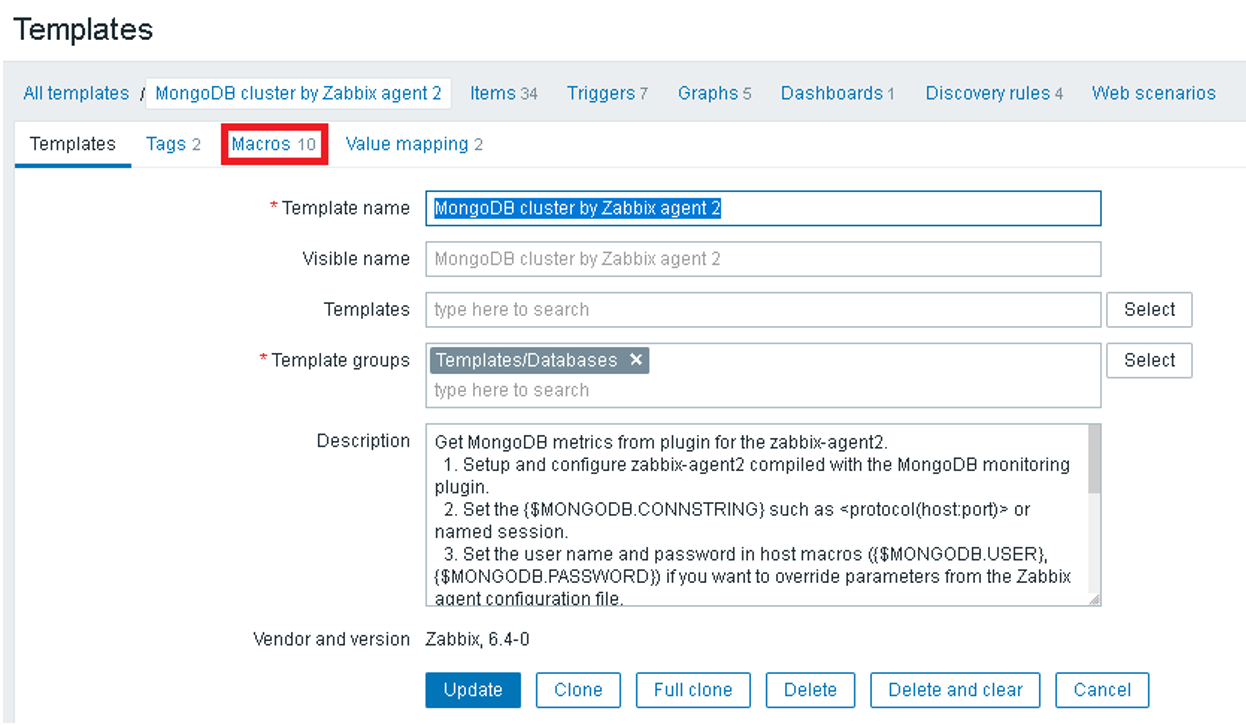
- Go to “Data collection” > “Hosts”, then click on any FileCloud Server node.
- Click on “MongoDB cluster by Zabbix agent 2.”
- A new browser window will be opened as per the image below; click on “Macros.”
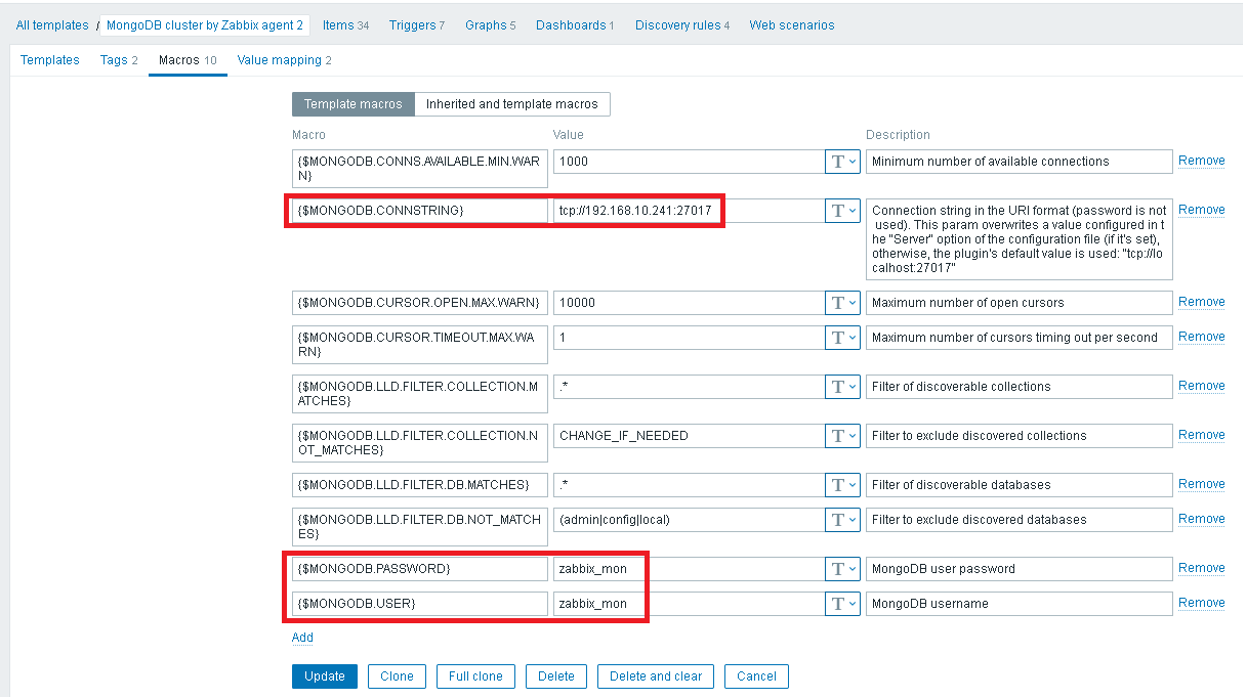
- Change the parameters “{$MONGODB.CONNSTRING}” | “{$MONGODB.PASSWORD}” and “{$MONGODB.USER}” as per the below example:
- The “{$MONGODB.CONNSTRING}” parameter should point to the MongoDB IP address.
Open Zabbix Appliance Charts
Now, it’s possible to see Zabbix Appliance populating charts.
Go to Monitoring > Hosts > then click on “Graphs” from any FileCloud Server node: 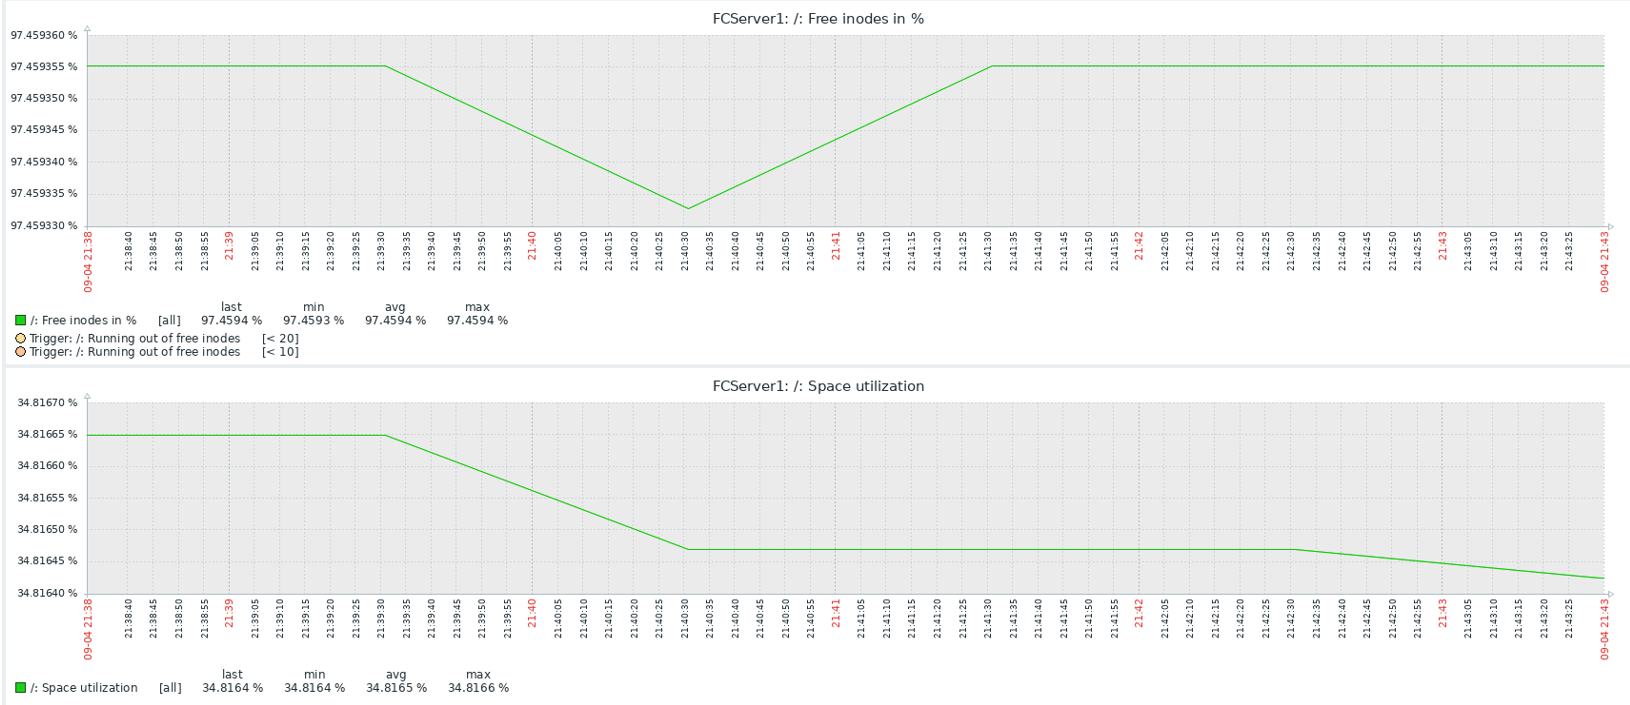
As a test, let’s shut down one FileCloud Server node (FCServer1); you will see an alert in “Dashboards” > “Host availability” and “Current problems” widgets as per the below example: 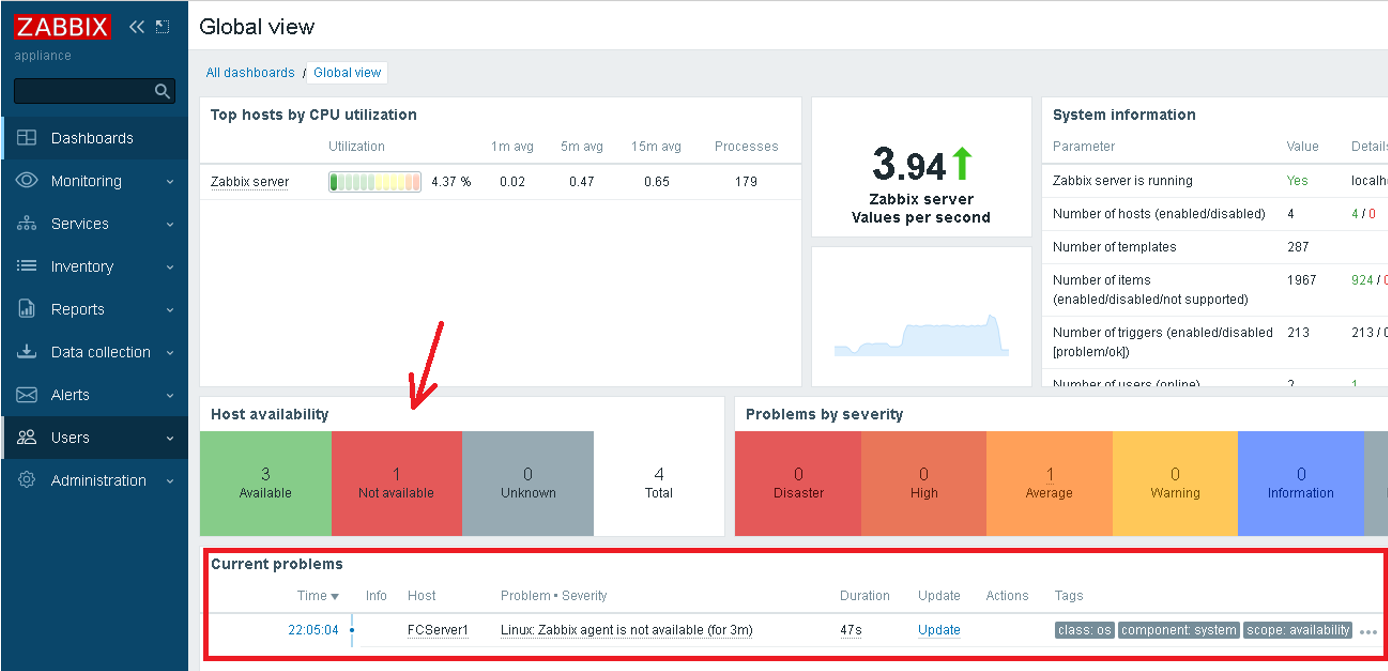
It’s also possible to configure alerts (for example: receive an alert via email when a node is not available). To do so, follow the instructions from the Zabbix documentation for “Receiving Problems Notifications” and Event Notifications.
Conclusion
FileCloud’s flexibility and extensibility make it a dynamic solution for enterprise IT environments that rely on different tools and applications to execute daily and critical operations. By integrating with open software like Zabbix, system administrators can monitor their FileCloud instance and enable secure file sharing, collaboration, and data governance.
To learn more about configuring FileCloud Server with third-party applications, check out our documentation or reach out to our support team.
Article written by Rafael Vilela, Solutions Engineer
Edited by Katie Gerhardt, Jr. Product Marketing Manager

By Katie Gerhardt
Jr. Product Marketing Manager